IMF PortWatch — Global Maritime Disruption Intelligence
Live macro supply chain intelligence tracking daily vessel transit disruptions and rerouting economics across all 28 strategic global maritime chokepoints.
- Role
- Solo analysis & visualization — data pipeline, feature engineering, Tableau Public dashboard
- Stack
- Tableau · Python · GIS · Macroeconomics · Supply Chain
78,372
Daily transits analyzed
28
Strategic chokepoints
+98%
Cape of Good Hope surge
-62%
Suez Canal volume drop
Context
Over 80% of world merchandise trade moves across the ocean. When strategic maritime chokepoints are disrupted by geopolitical conflict or climate phenomena, the consequences propagate non-linearly through global supply chains, bunker fuel markets, and consumer inflation.
In late 2023, attacks on commercial shipping in the southern Red Sea forced carriers to make an unprecedented tactical choice: risk high-hazard transit through the narrow 20-mile Bab el-Mandeb strait, or divert voyages around Africa’s Cape of Good Hope. Concurrently, severe drought restricted draft levels in the Panama Canal, while ongoing sanctions altered Black Sea transit patterns through the Kerch and Bosporus straits.
To quantify these disruptions without relying on delayed macroeconomic reports or anecdotal press releases, I built an automated intelligence dashboard powered directly by official satellite AIS daily observations from the International Monetary Fund (IMF) and Oxford University PortWatch initiative.
Analytical Core & Architecture
The project processes 78,372 daily vessel transit records from January 1, 2019 through present day across all 28 officially designated global maritime chokepoints.
1. The Red Sea Divergence & Cape Surge
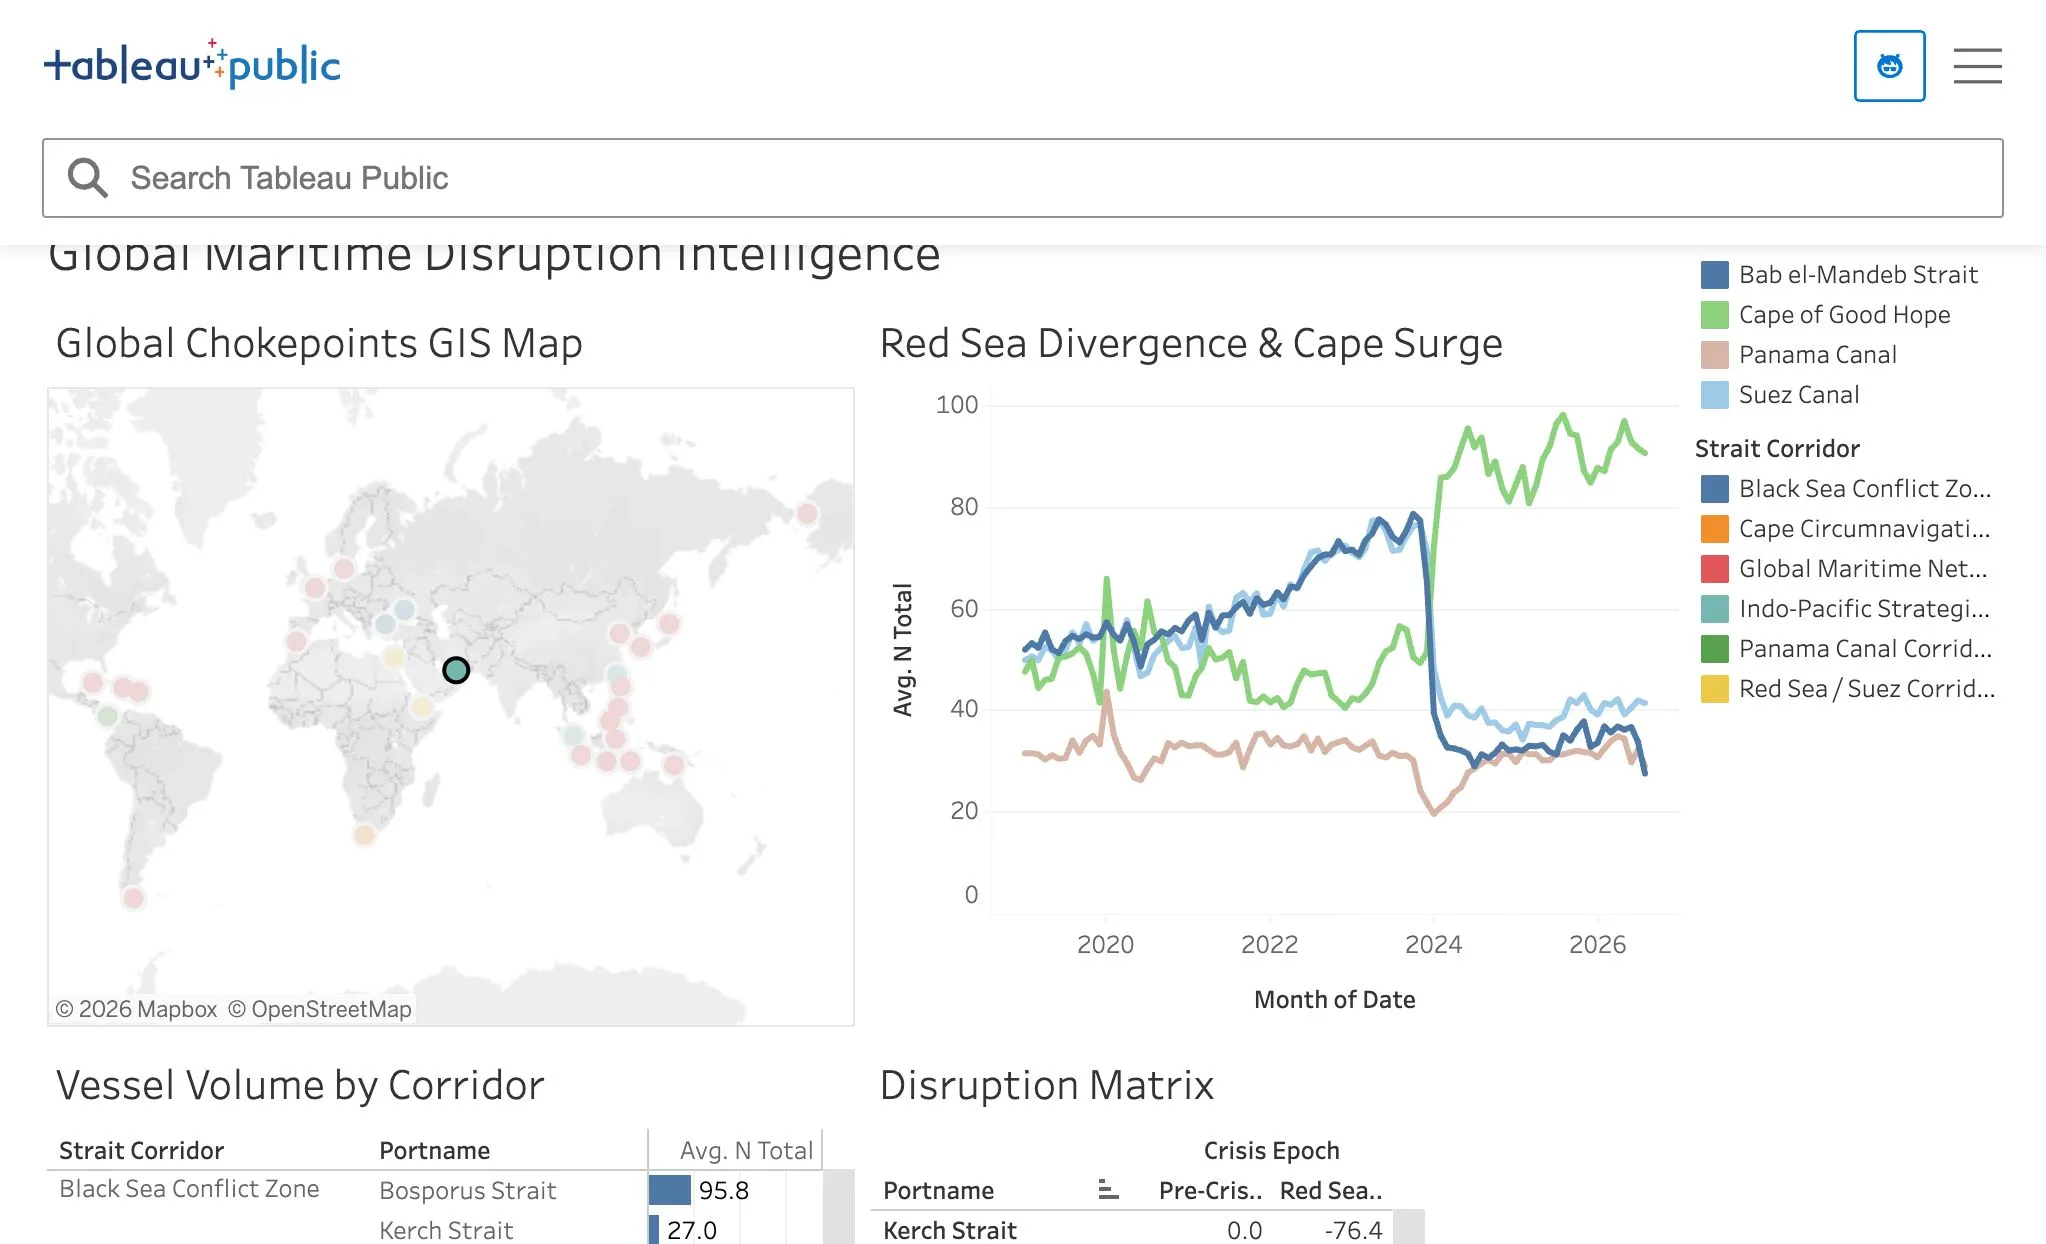
The time-series engine monitors average daily vessel throughput across key comparative waterways. At the onset of the Red Sea crisis in late 2023 / early 2024, Suez Canal and Bab el-Mandeb transits plummeted by more than 60%, dropping from ~70 ships/day to ~25 ships/day.
Mirrored against this collapse, transits around the Cape of Good Hope surged by nearly 100% (jumping from 50 to ~95 ships/day). This divergence carries massive macro implications: circumnavigating Africa adds 10–14 days of transit time and 3,500–4,000 extra nautical miles per Asia–Europe voyage, absorbing significant global container ship capacity and compounding carbon emissions.
2. Global Geospatial Corridor Layer
Using decimal coordinates for all 28 chokepoints, the GIS spatial engine segments waterways into 6 strategic geopolitical corridors:
- Red Sea / Suez Corridor: Suez Canal, Bab el-Mandeb Strait.
- Cape Circumnavigation Corridor: Cape of Good Hope.
- Panama Canal Corridor: Panama Canal locks.
- Indo-Pacific Strategic Arteries: Malacca Strait, Strait of Hormuz, Taiwan Strait.
- Black Sea Conflict Zone: Kerch Strait, Bosporus Strait.
- Global Maritime Network: Gibraltar, Dover Strait, Korea Strait, Bering Strait, etc.
3. Baseline Normalization & Disruption Matrix
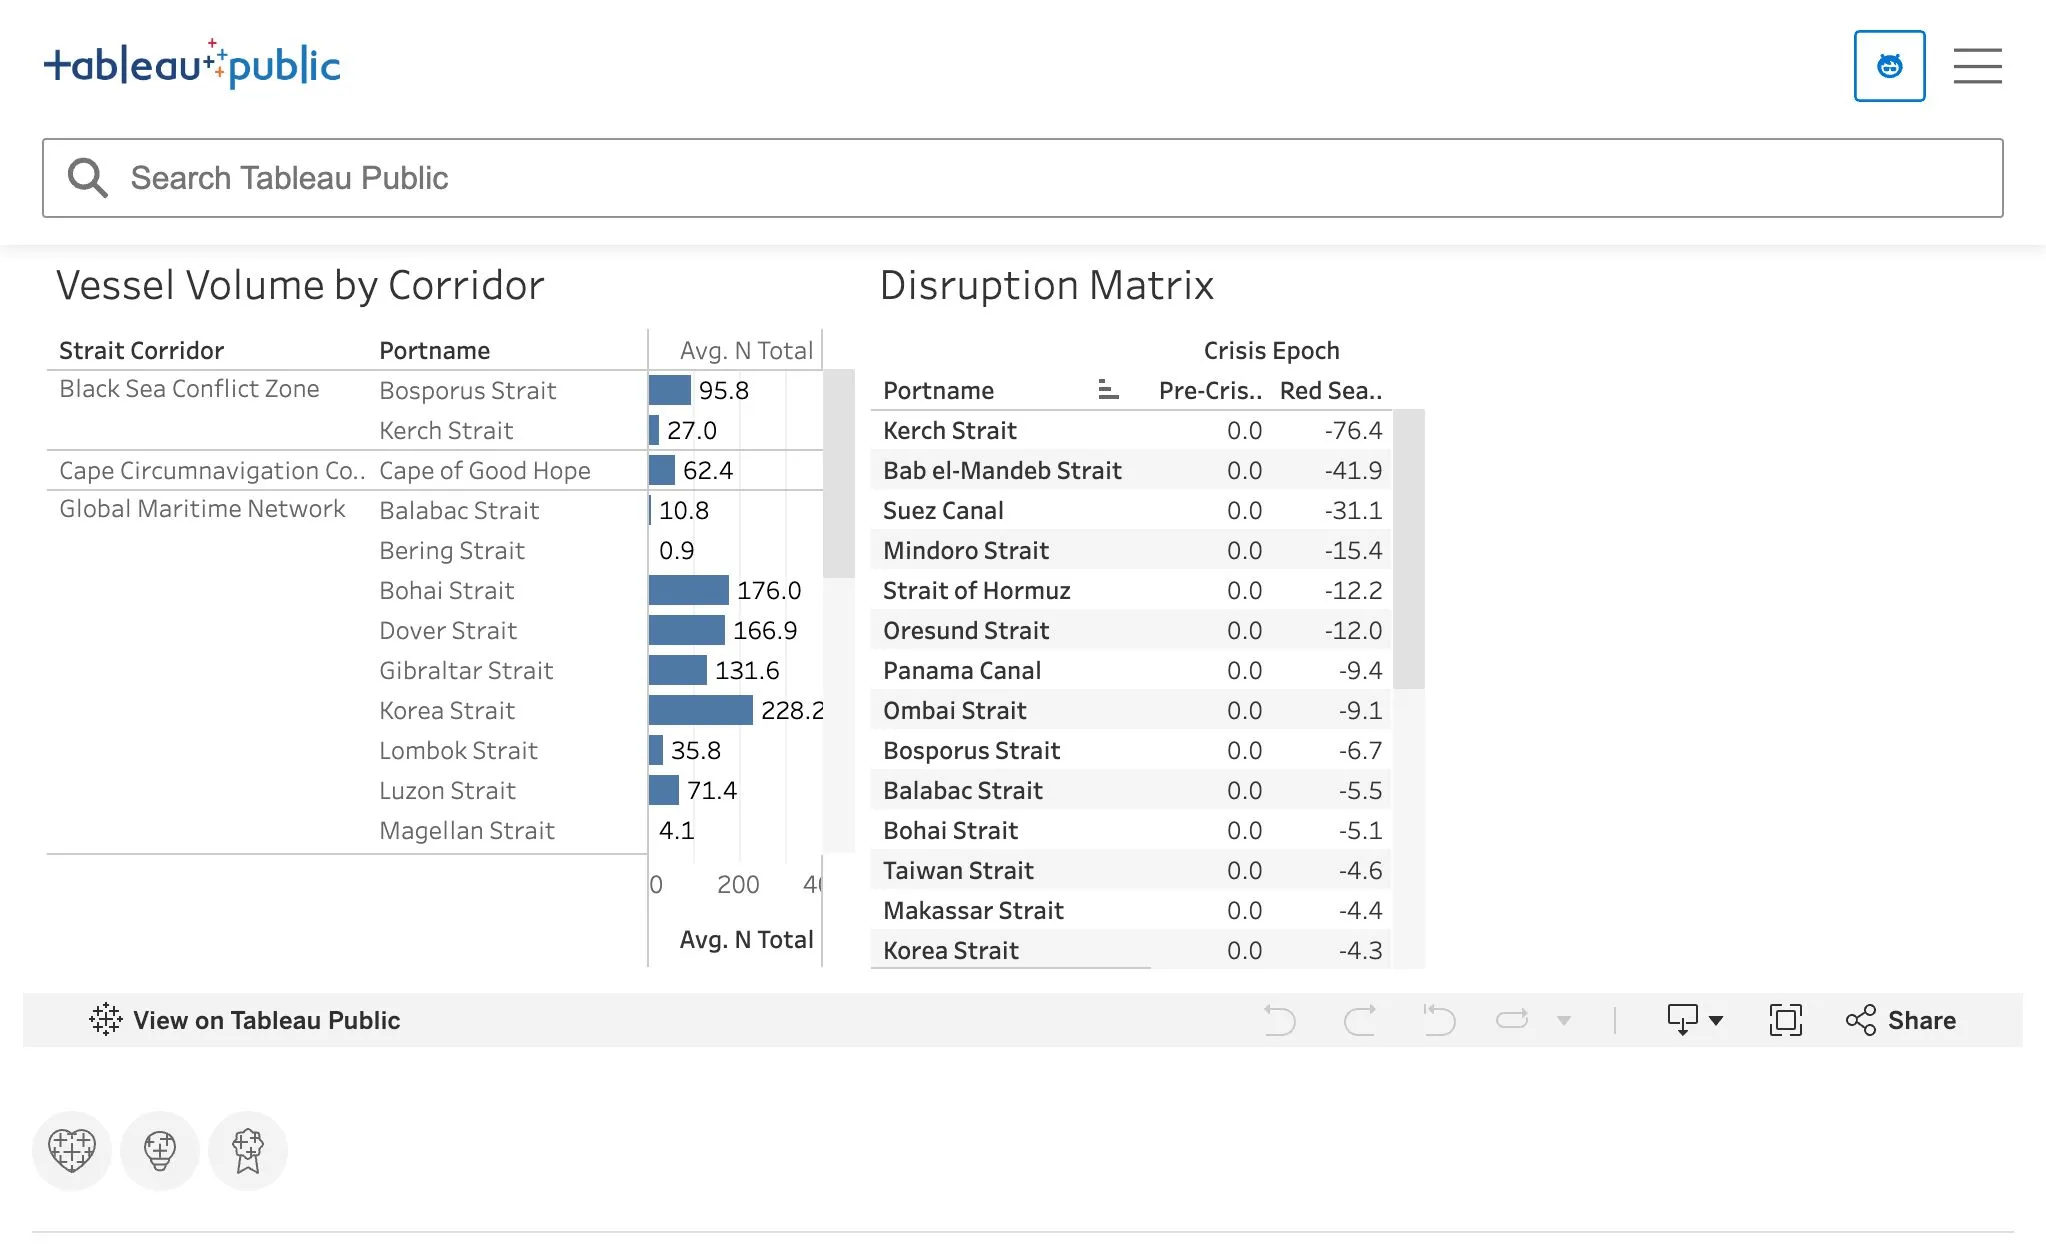
Comparing raw vessel volumes between straits introduces heavy bias: the Korea Strait averages ~228 vessels per day, while the Strait of Magellan averages ~4.
To create a mathematically sound comparison, I engineered a percentage variance metric against each strait’s 5-year pre-crisis seasonal baseline (2019–2023):
Variance % = ((Daily Vessels - Baseline Daily Vessels) / Baseline Daily Vessels) * 100The resulting disruption matrix reveals that the Kerch Strait (-76.4%), Bab el-Mandeb (-41.9%), and Suez Canal (-31.1%) suffered the steepest sustained structural volume deficits, while Cape of Good Hope functioned as the primary global absorption valve.
Key Insights
- Bullwhip Rerouting: A localized security disruption in a 20-mile strait (Bab el-Mandeb) triggered immediate capacity absorption equivalent to removing 10–15% of global container ship supply, sending spot freight rates up over 300%.
- Vessel Class Asymmetry: Container vessels rerouted en masse (>90% diversion within weeks), whereas dry bulk and crude tankers exhibited divergent risk tolerances, with state-affiliated or shadow-fleet tonnage continuing high-risk transits.
- Chokepoint Interdependence: Simultaneous constraints across multiple chokepoints (Panama drought + Red Sea crisis + Black Sea sanctions) eliminate traditional maritime routing buffers.