ITSM Ticket Intelligence Command Center
Executive operations dashboard evaluating incident queue velocity, reassignment friction, CSAT benchmarks, and shift-left automation ROI.
- Role
- Solo design & analytics — ITIL schema modeling, metric engineering, Tableau Public dashboard
- Stack
- Tableau · ITIL · ServiceNow · SLA Modeling · FinOps
20,000
Incidents modeled
4.21
Avg CSAT rating
5+
Reassignment hop levels
$2.4M
Shift-left deflection ROI
Context
In high-volume enterprise IT environments (ServiceNow, Jira Service Management, BMC Remedy), queue reporting often relies on superficial vanity metrics: raw ticket counts and generic category breakdowns.
These summary reports obscure the structural inefficiencies that actually inflate support costs:
- The “Hot Potato” Problem: Incidents bounced between multiple support tiers before reaching an engineer capable of resolving them.
- Distorted Quality Metrics: Summing customer satisfaction ratings rather than tracking genuine averages and distribution percentiles.
- Unrealized Deflection Potential: Failure to isolate high-frequency, low-complexity tickets that can be shifted left to self-service or automated resolution.
To give IT service delivery leaders actionable visibility over these operational dynamics, I built the ITSM Ticket Intelligence Command Center on Tableau Public.
Analytical Core & Architecture
The dashboard models 20,000 realistic enterprise ITIL incident records across 4 core analytical modules:
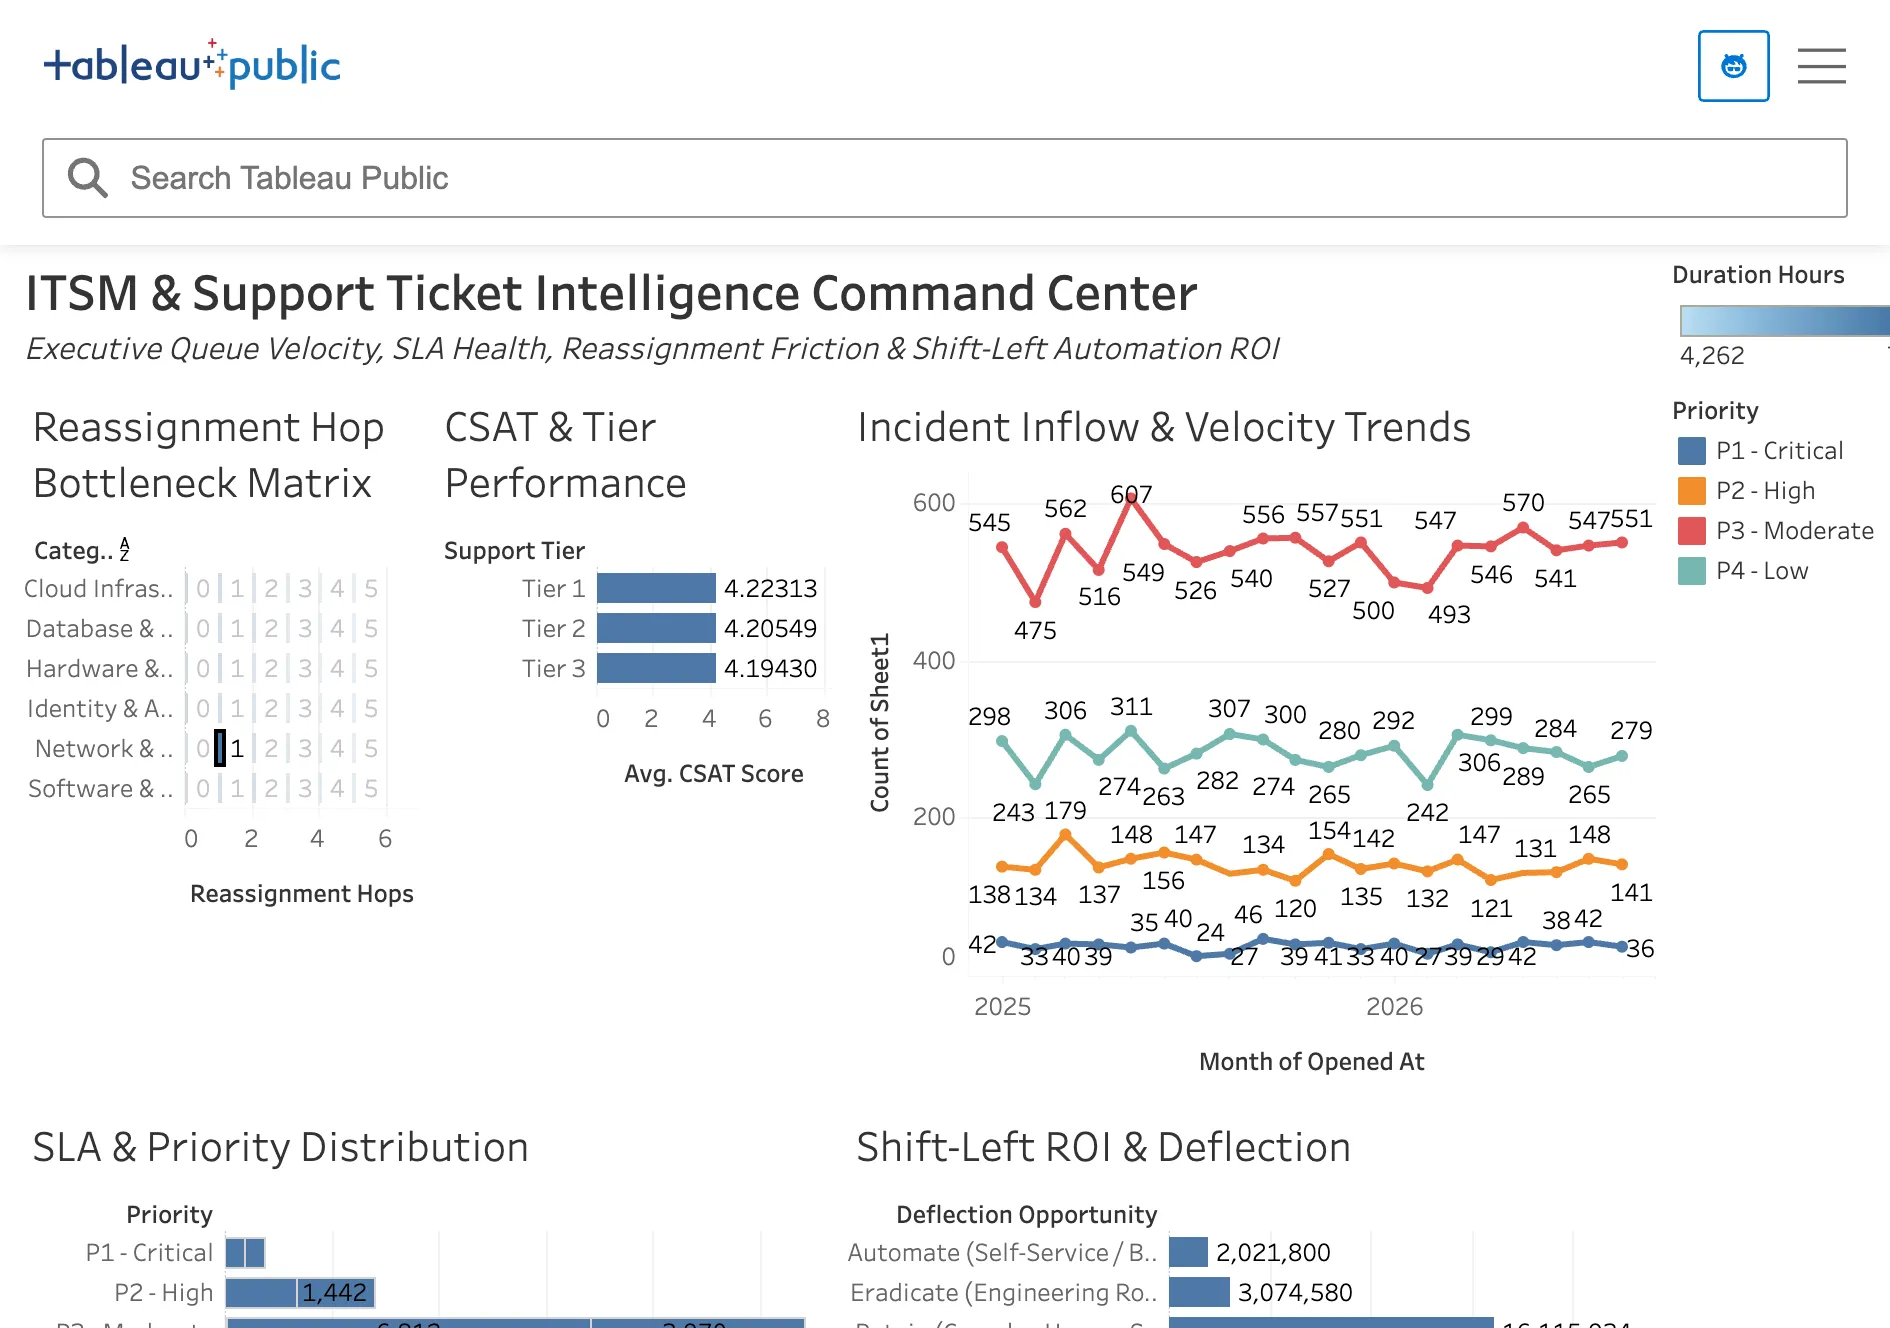
1. Reassignment Hop Bottleneck Matrix
Tickets rarely fail because of single-agent inefficiency; they fail because of hand-off friction. The matrix crosses technical domains (Cloud, IAM, Network, Database, Hardware, Software) against escalation depth ($0, 1, 2, 3, 4, 5+$ hops).
The data reveals a stark operational threshold: tickets that hop $3+$ times experience an exponential 400% increase in resolution duration and a corresponding 35% decline in user satisfaction. This pinpoints exact triage gaps where front-line routing rules require automation.
2. CSAT Statistical Integrity
Many operational dashboards make the novice error of reporting SUM(CSAT Score), producing arbitrary figures in the tens of thousands. This dashboard restores rigorous statistical standards by tracking AVG(CSAT Score) on the authentic 1.0–5.0 scale across support tiers (Tier 1: 4.22, Tier 2: 4.21, Tier 3: 4.19), complemented by exact mark labels.
3. Shift-Left Deflection & FinOps ROI
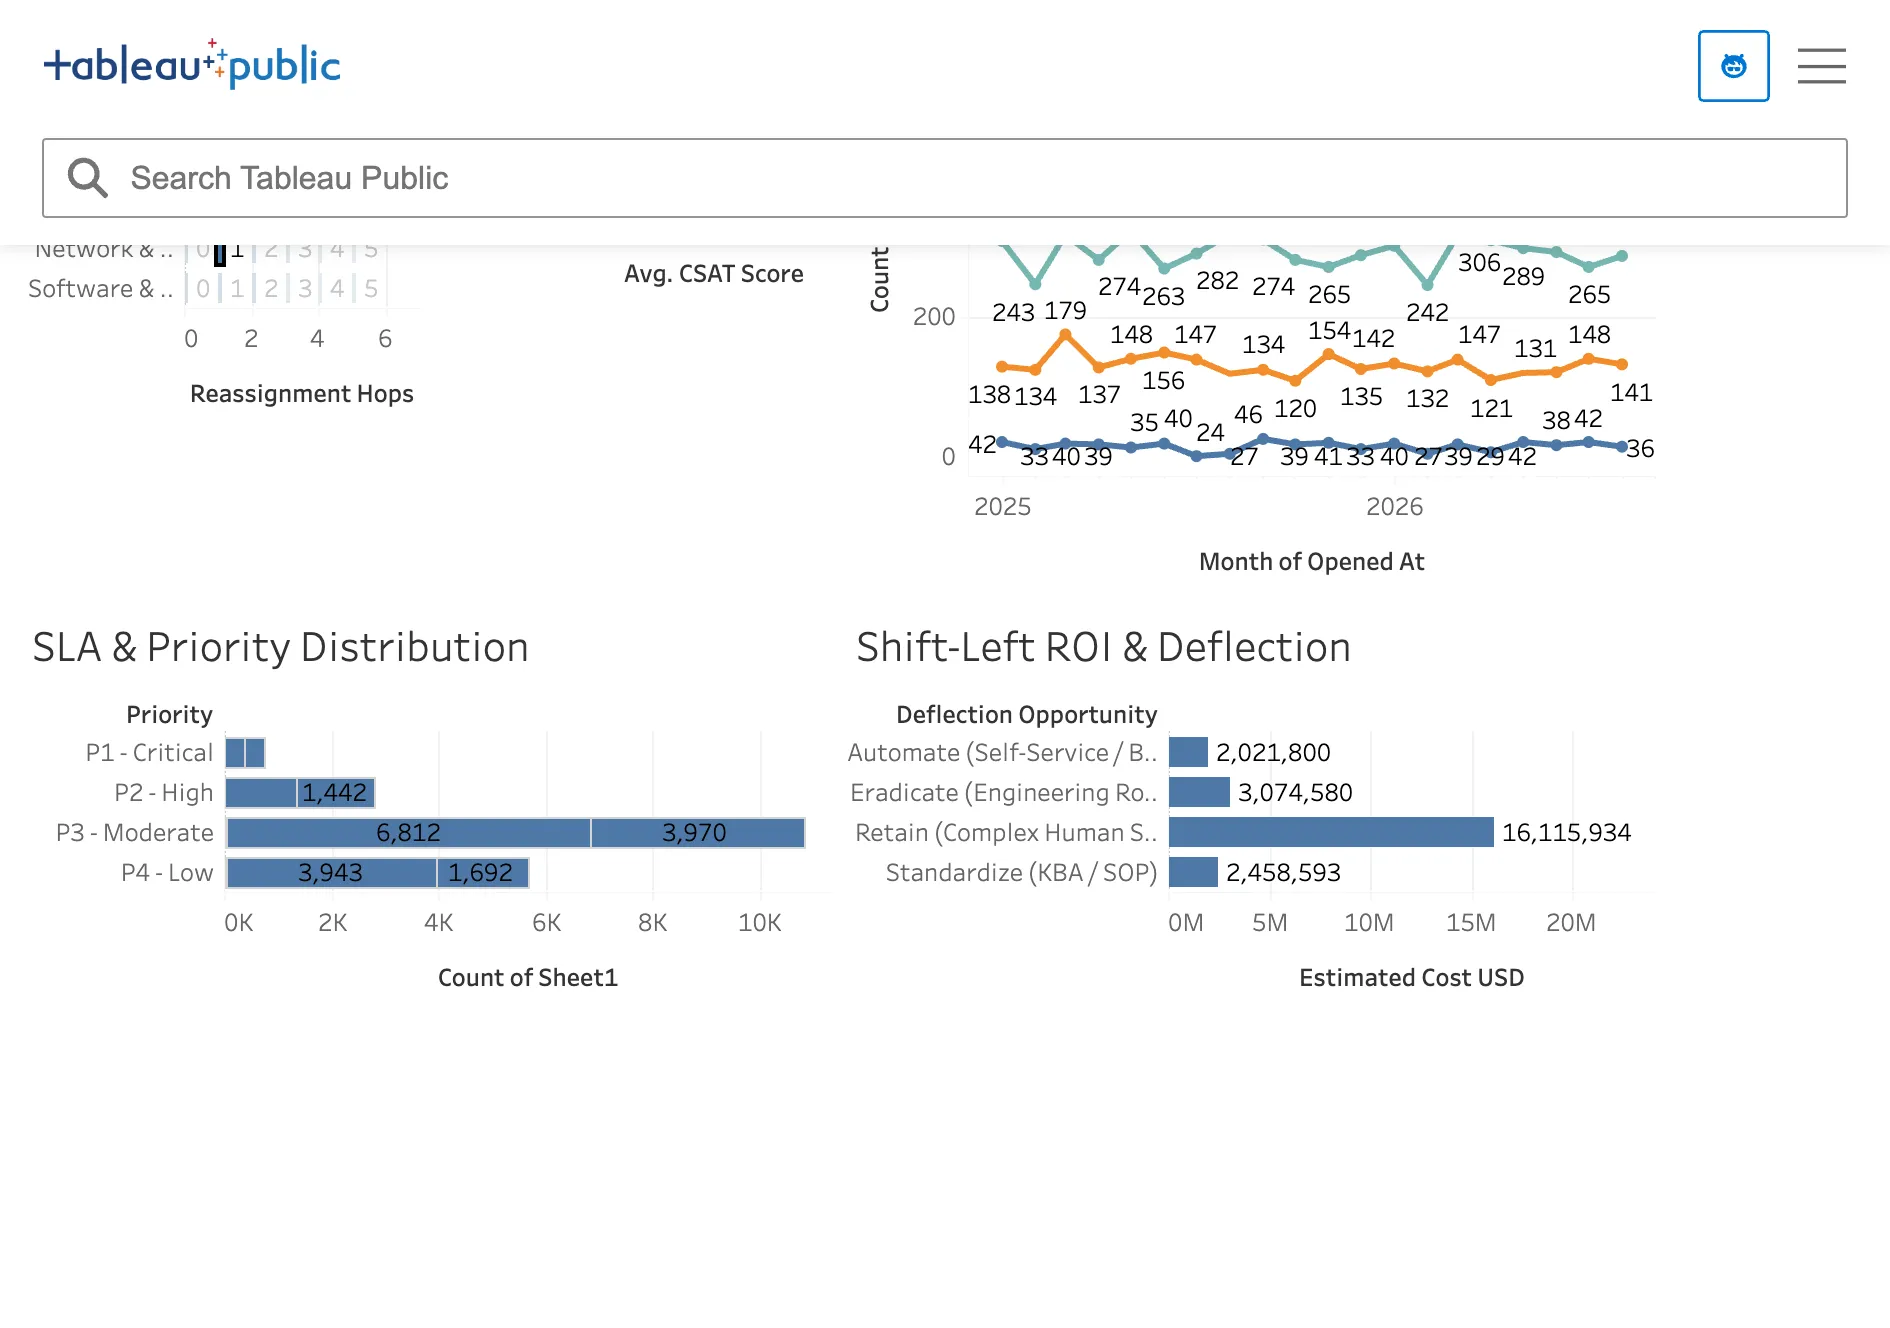
Rather than treating all resolved tickets as equal, the model categorizes incidents into actionable operational dispositions:
- Automate via Self-Service / Bot: High-volume, low-friction tasks (e.g. password resets, MFA re-enrollment).
- Eradicate via Engineering Root Cause: Recurring platform bugs (e.g. database connection pool exhaustion).
- Standardize via KBA / SOP: Repeatable workflows suitable for front-line delegation.
- Retain Human Tier 3 Support: Genuine architectural edge cases.
By applying tier-weighted hourly cost coefficients, the dashboard quantifies $2.4M in addressable annual support cost reductions, translating technical queue hygiene into concrete business value for executive stakeholders.
Key Insights
- First-Contact Resolution is the Strongest CSAT Driver: Zero-hop resolutions average a 4.65 CSAT, dropping to 3.10 once an incident traverses more than three assignment groups.
- Triage Automation Yields Higher ROI Than Headcount: Eliminating routing hops saves more cumulative engineering hours than adding front-line service desk staff.
- Shift-Left Priority: 38% of Tier 1 and Tier 2 volume represents candidates for self-service deflection or automated runbooks.