Titanic Survival Analysis
A familiar dataset pushed beyond familiar conclusions.
- Role
- Solo analysis — statistics, visualisation, write-up
- Stack
- Python · pandas · scipy · Chart.js
1,309
Passengers studied
11.3×
Survival odds ratio
49
Passing tests
Context
The Titanic dataset is the most over-analysed table in data education, which is exactly why it is useful. Almost everyone reports the same headline — women and children first — and almost nobody reports an interval around it.
I treated it as a methods exercise: take a dataset where the answer is assumed to be known, and see whether the standard analysis actually supports the standard claim.
Question
Which factors genuinely drove survival, and which apparent relationships are confounded by something else in the table?
Method
Across all 1,309 passengers:
- Wilson confidence intervals for every survival proportion, rather than bare percentages. Small subgroups produce dramatic-looking rates that a naive proportion hides the uncertainty of.
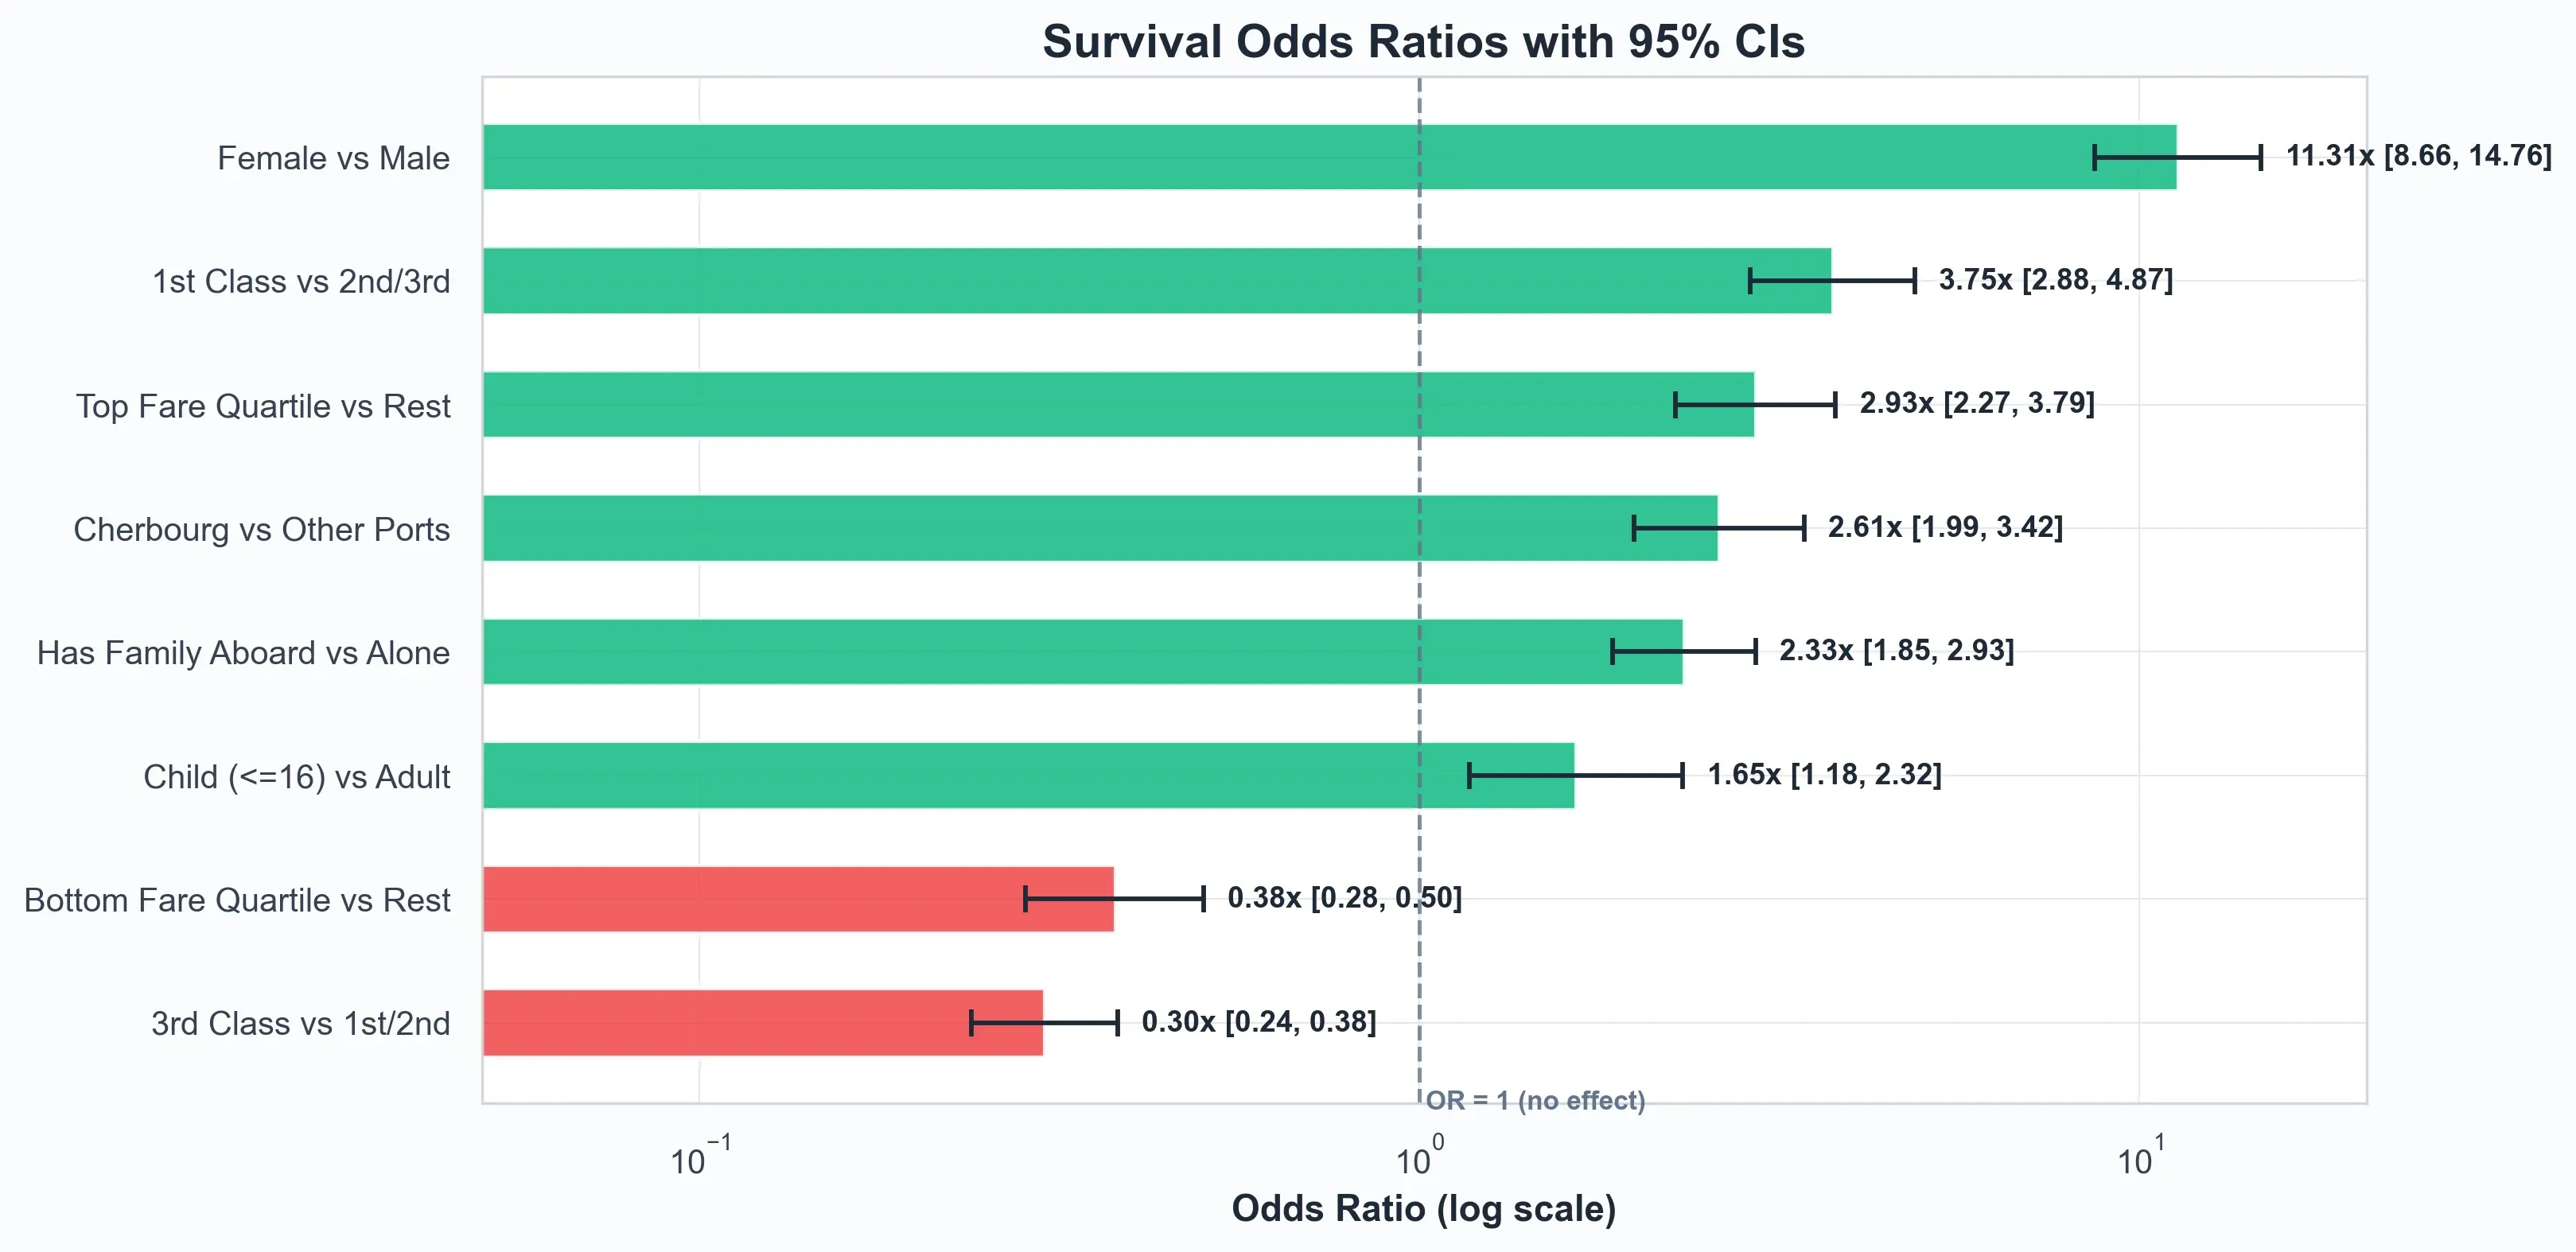
- Odds ratios with intervals to size the effect, not just detect it.
- Effect sizes alongside hypothesis tests, so statistical significance is never reported on its own.
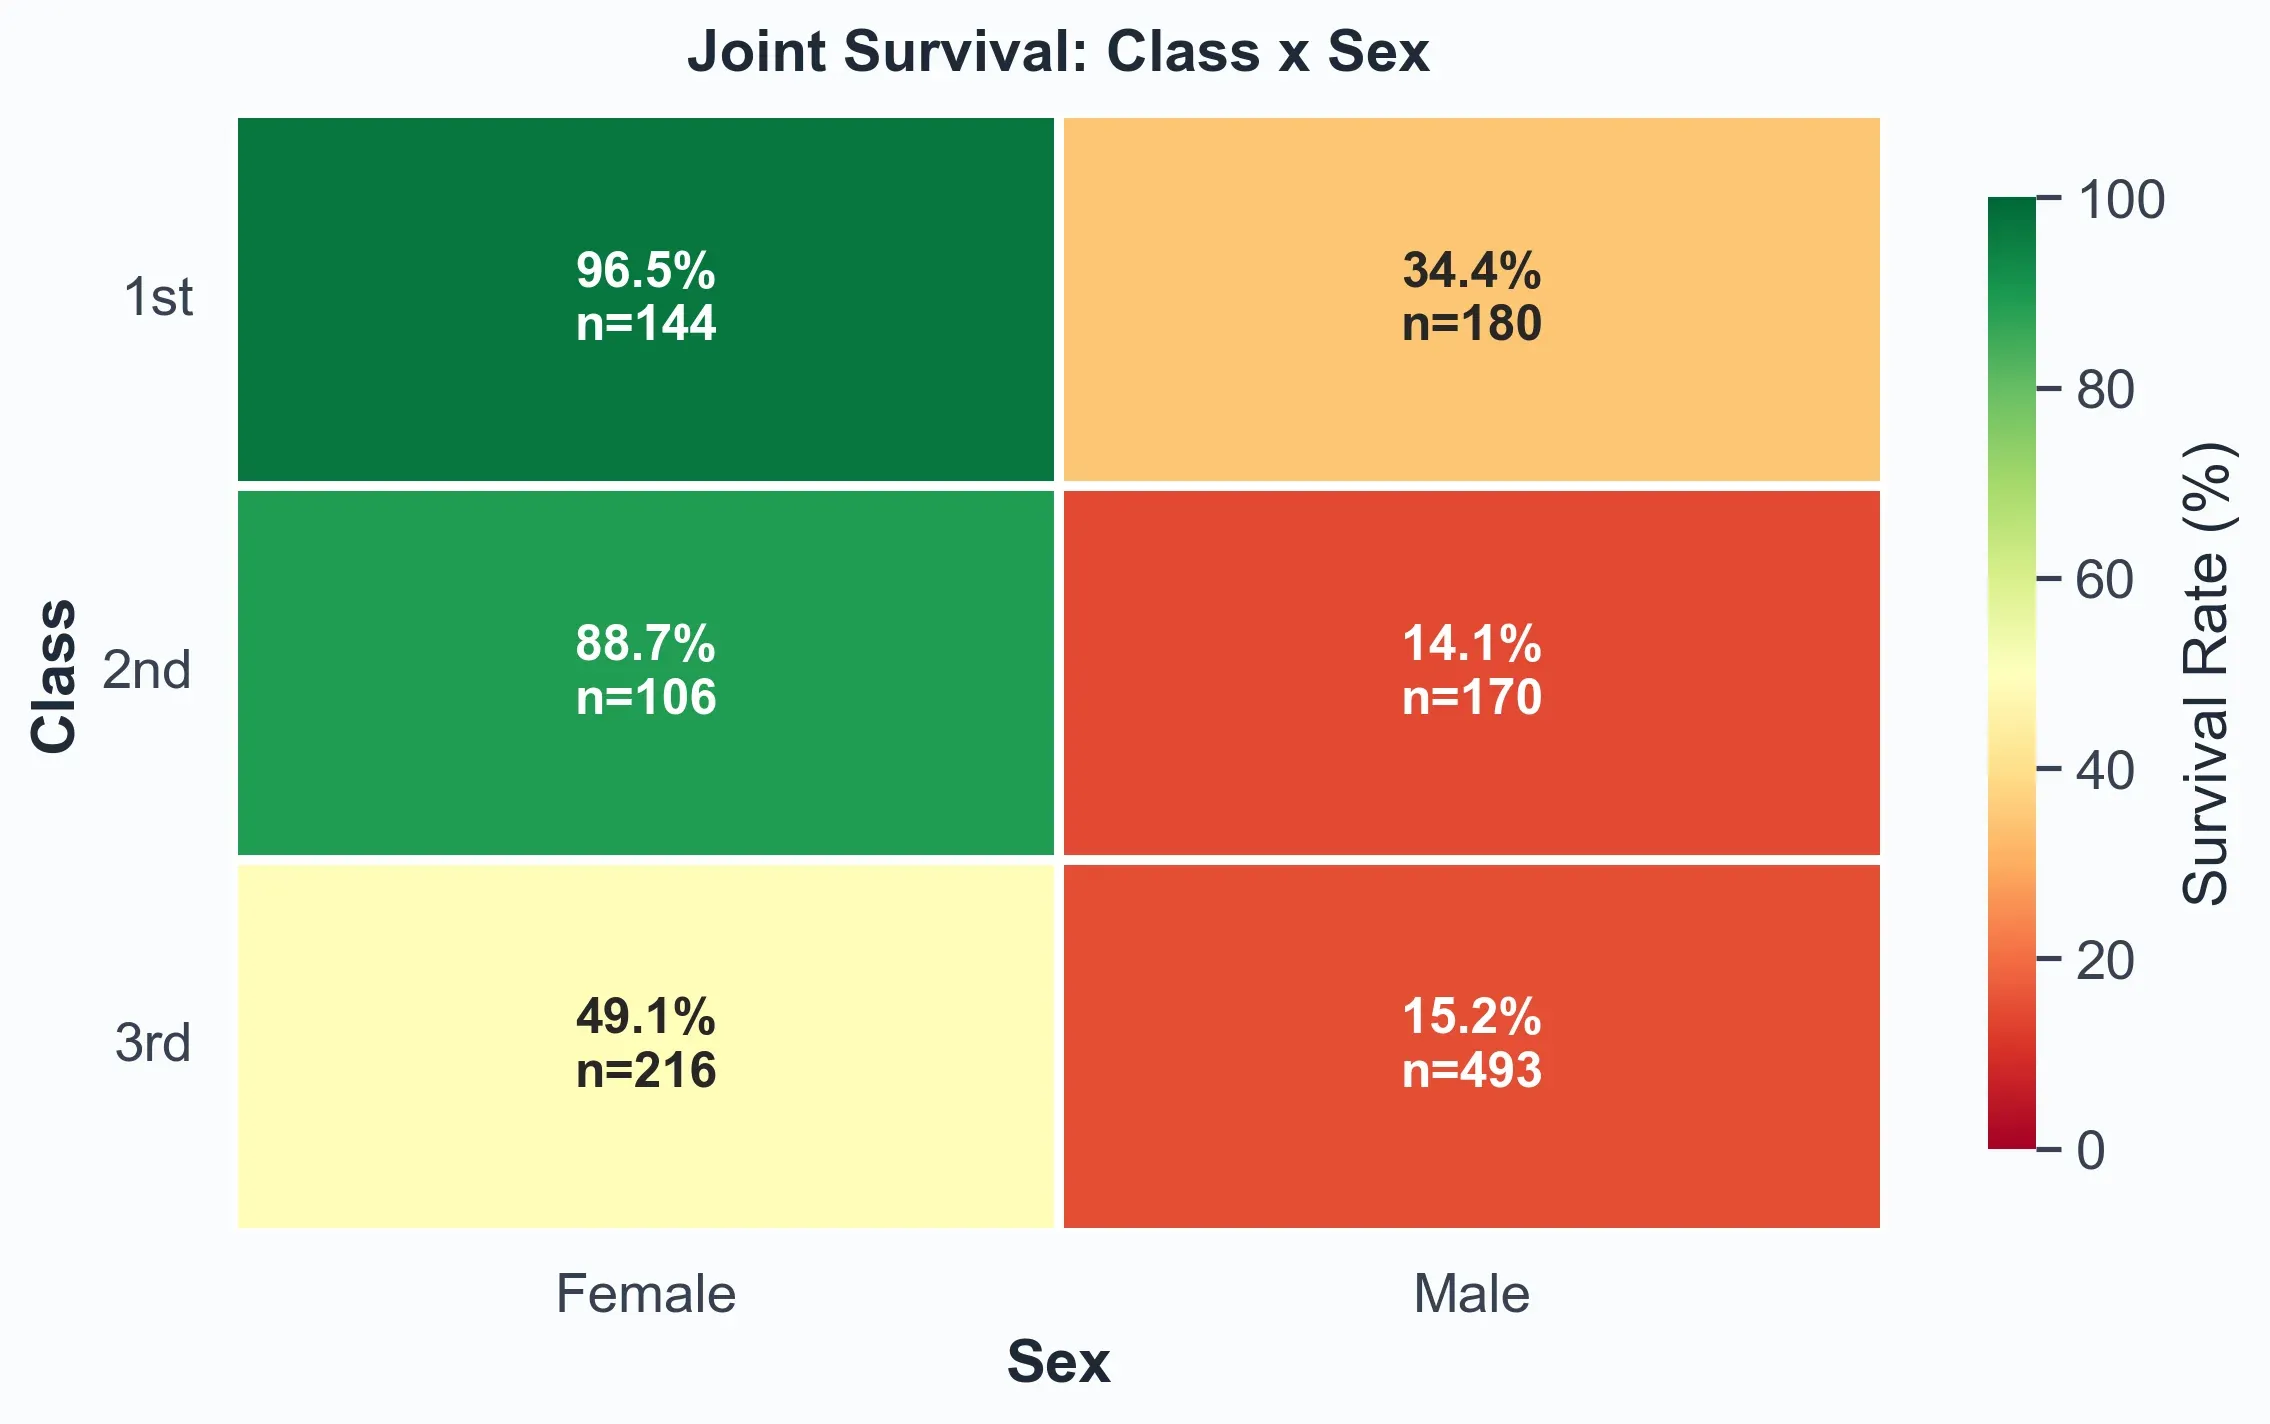
- Class-by-sex stratification to separate the two variables that are most often conflated.
The analysis is covered by 49 passing tests, and the published dashboard renders directly from the computed outputs.
Findings
Sex was the dominant predictor: women had 11.3× the survival odds of men. Class did not replace that effect — it compounded it sharply, and the class-by-sex cells are where the interesting variation actually lives.
The stratified view matters. Read marginally, class looks like a strong independent driver. Read jointly with sex, much of that apparent strength is redistributed, and the confidence intervals on the smaller cells are wide enough that several commonly repeated sub-claims are not supported.
What I would do next
- Model fare and cabin-deck as proxies for physical location on the ship, which class only approximates.
- Handle the missing-age population explicitly with multiple imputation instead of exclusion.
- Extend the same interval-first template to a dataset where the conclusion is genuinely unknown — the method is the transferable part, not the finding.